
The substantial wealth gap between Malaga and Marbella’s richest and poorest neighbourhoods has been laid bare in new official figures.
According to the latest statistics from Spain’s Tax Agency (Agencia Tributaria), covering income tax returns for 2024, Malagueta-Monte Sancha is Malaga city’s richest area, with an average declared gross annual income of €64,338.
At the opposite end of the scale is Martiricos-La Roca-Palma-Palmilla, where the average stands at just €21,780.
That represents a difference of €42,558 a year, with the wealthiest area’s declared income approximately 2.95 times higher.
While average incomes in Malagueta-Monte Sancha and Cerrado de Calderon-Hacienda Paredes rose by around 10% compared with the previous year, those in Martiricos-La Roca-Palma-Palmilla increased by just 3%.
The figures provide a revealing snapshot of the economic inequalities within one of Spain’s fastest-growing cities, where affluent coastal neighbourhoods and lower-income residential districts sit just a few kilometres apart.
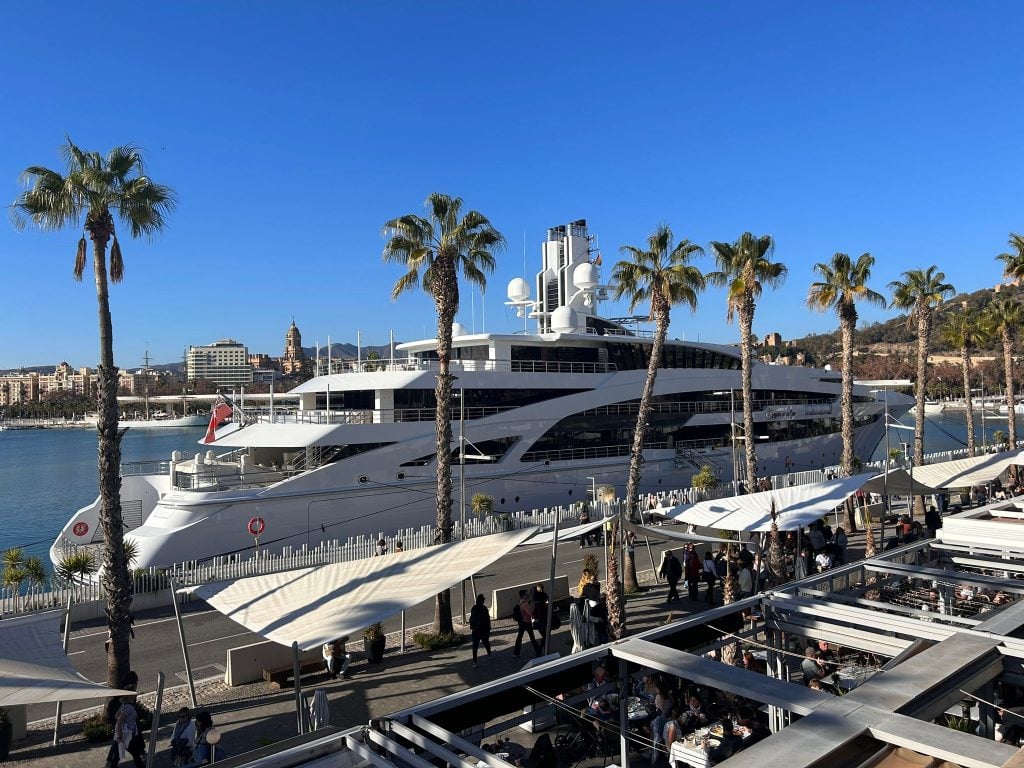
Malaga’s richest and poorest barrios ranked
The Tax Agency’s figures show average gross annual income per income tax filer, rather than the average salary of every resident.
| Rank | Neighbourhood / postal district | Average gross income |
|---|---|---|
| 1 | Malagueta–Monte Sancha | €64,338 |
| 2 | Cerrado de Calderón–Hacienda Paredes | €48,212 |
| 3 | Ensanche Centro–Soho | €43,963 |
| 4 | Pedregalejo–Morlaco–Las Acacias–El Palo | €41,874 |
| 5 | La Goleta–San Felipe Neri–Historic Centre | €35,441 |
| 6 | El Bulto–Jardín de la Abadía–La Princesa | €33,343 |
| 7 | La Merced–Barcenillas–Seminario | €32,727 |
| 8 | Guadalhorce Industrial Estate–Guadalmar–Carretera de Cádiz | €32,566 |
| 9 | Churriana–La Noria–Buenavista | €31,992 |
| 10 | Bailén–Miraflores–Suárez–Teatinos | €31,880 |
| 11 | El Chaparral–Los Morales–Torremar | €31,734 |
| 12 | Carranque–Hazas Cuevas | €30,990 |
| 13 | Olletas–Sierra Blanquilla–El Ejido | €29,533 |
| 14 | Perchel Norte–La Trinidad | €27,035 |
| 15 | Cruz de Humilladero | €25,791 |
| 16 | Ciudad Jardín | €25,123 |
| 17 | Campanillas–Puerto de la Torre | €24,669 |
| 18 | Barceló–El Torcal–Girón–Vistafranca–La Cordobesa | €24,153 |
| 19 | Campanillas | €24,121 |
| 20 | Martiricos–La Roca–Palma-Palmilla | €21,780 |
The figures underline how the city’s eastern coastal districts dominate the upper end of the income rankings.
Malagueta-Monte Sancha comfortably leads the list, with average declared income more than €16,000 higher than the second-placed district, Cerrado de Calderón-Hacienda Paredes.
Meanwhile, the fashionable Soho neighbourhood and the established residential areas around Pedregalejo and El Palo also feature among the city’s four highest-income districts.
At the lower end, Palma-Palmilla, Campanillas and parts of Carretera de Cadiz record considerably more modest incomes.
Marbella’s richest neighbourhoods
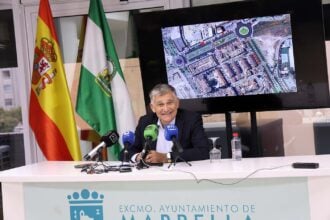
The Tax Agency’s statistics also provide a breakdown of income levels across Marbella, revealing substantial differences between its exclusive residential areas and more traditional neighbourhoods.
The wealthiest district is Nagüeles-La Carolina-El Vicario, where taxpayers declare an average gross income of €48,069.
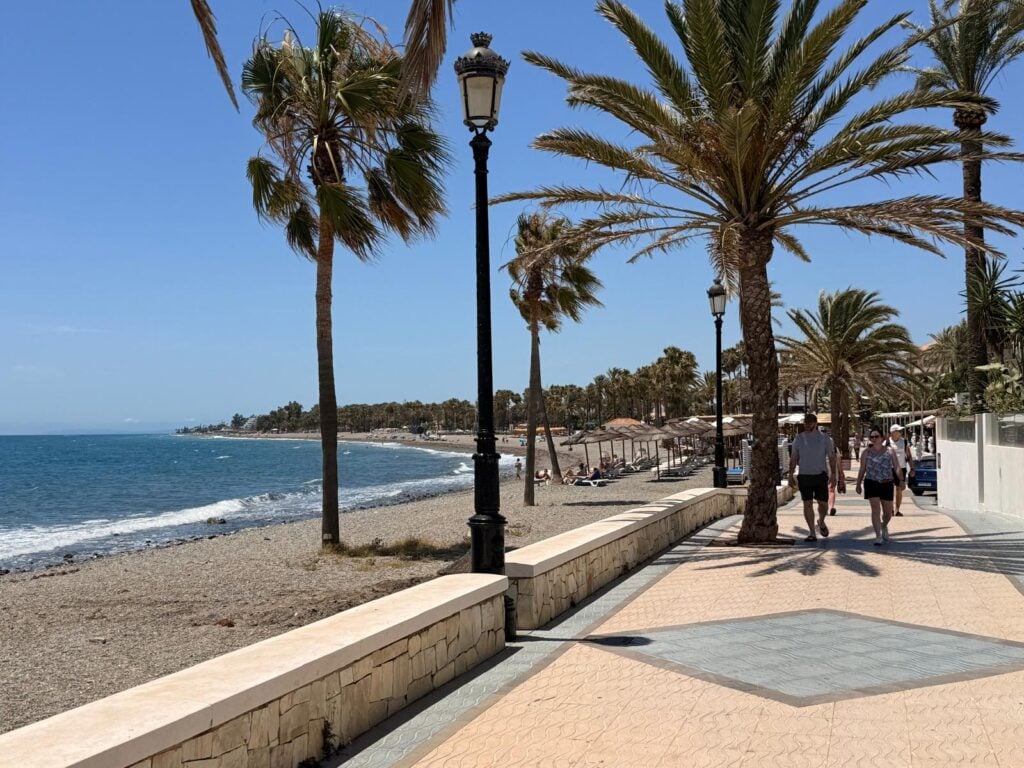

This is followed by Las Chapas-El Rosario-Elviria-Cabopino-Ricmar, with €40,865, and Nueva Andalucía-Puerto Banus, where the figure stands at €37,094.
| Rank | Marbella district | Average gross income |
|---|---|---|
| 1 | Nagüeles–La Carolina–El Vicario | €48,069 |
| 2 | Las Chapas–El Rosario–Elviria–Cabopino–Ricmar | €40,865 |
| 3 | Nueva Andalucía–Puerto Banús | €37,094 |
| 4 | Bello Horizonte–Lindasol–Río Real–Bahía de Marbella–Los Monteros | €30,311 |
| 5 | San Pedro de Alcántara–Guadalmina–Salto del Agua | €28,965 |
| 6 | Miraflores–Barrio Alto–Old Town–Divina Pastora | €28,649 |
The difference between Marbella’s highest and lowest listed districts is €19,420, meaning taxpayers in Nagüeles-La Carolina-El Vicario declare around 68% more income than those in Miraflores-Barrio Alto-Old Town-Divina Pastora.
Interestingly, even Marbella’s richest district falls well below Malaga city’s Malagueta-Monte Sancha area in terms of average declared gross income.
Why the richest areas earn so much more
The figures also reveal significant differences in where residents obtain their income.
Across Malaga city, employment-related income, which includes salaries and pensions, accounts for approximately 75% of total declared income.
Capital income, including returns from investments and rental properties, accounts for around 8%, while income from economic activities contributes 7.4%.
Capital gains make up a further 4.2%, with tax-exempt income representing approximately 4.8%.
However, the picture changes dramatically in Malaga’s wealthiest neighbourhoods.
In Malagueta-Monte Sancha, just 53% of declared income comes from employment and pensions.
Capital income accounts for 19%, while business and self-employment activities contribute 16%, and capital gains a further 7%.
A similar pattern emerges in Ensanche Centro-Soho, where employment-related income represents approximately 57.3% of the total.
By contrast, in lower-income areas such as Ciudad Jardin, Campanillas, Cruz de Humilladero and Palma-Palmilla, salaries and pensions account for more than 80% of declared income.
The figures suggest that investment returns, business earnings and other sources of income play a considerably greater role in the finances of taxpayers living in the city’s wealthiest areas.
Read more Andalucia news at the Spanish Eye.